Monday, September 23, 2024

Tag Archives: displacement

Housing Vacancy Survey Shows New York City Is in The Midst of An Affordability Emergency

Housing Vacancy Survey Shows New York City Is in The Midst of An Affordability Emergency

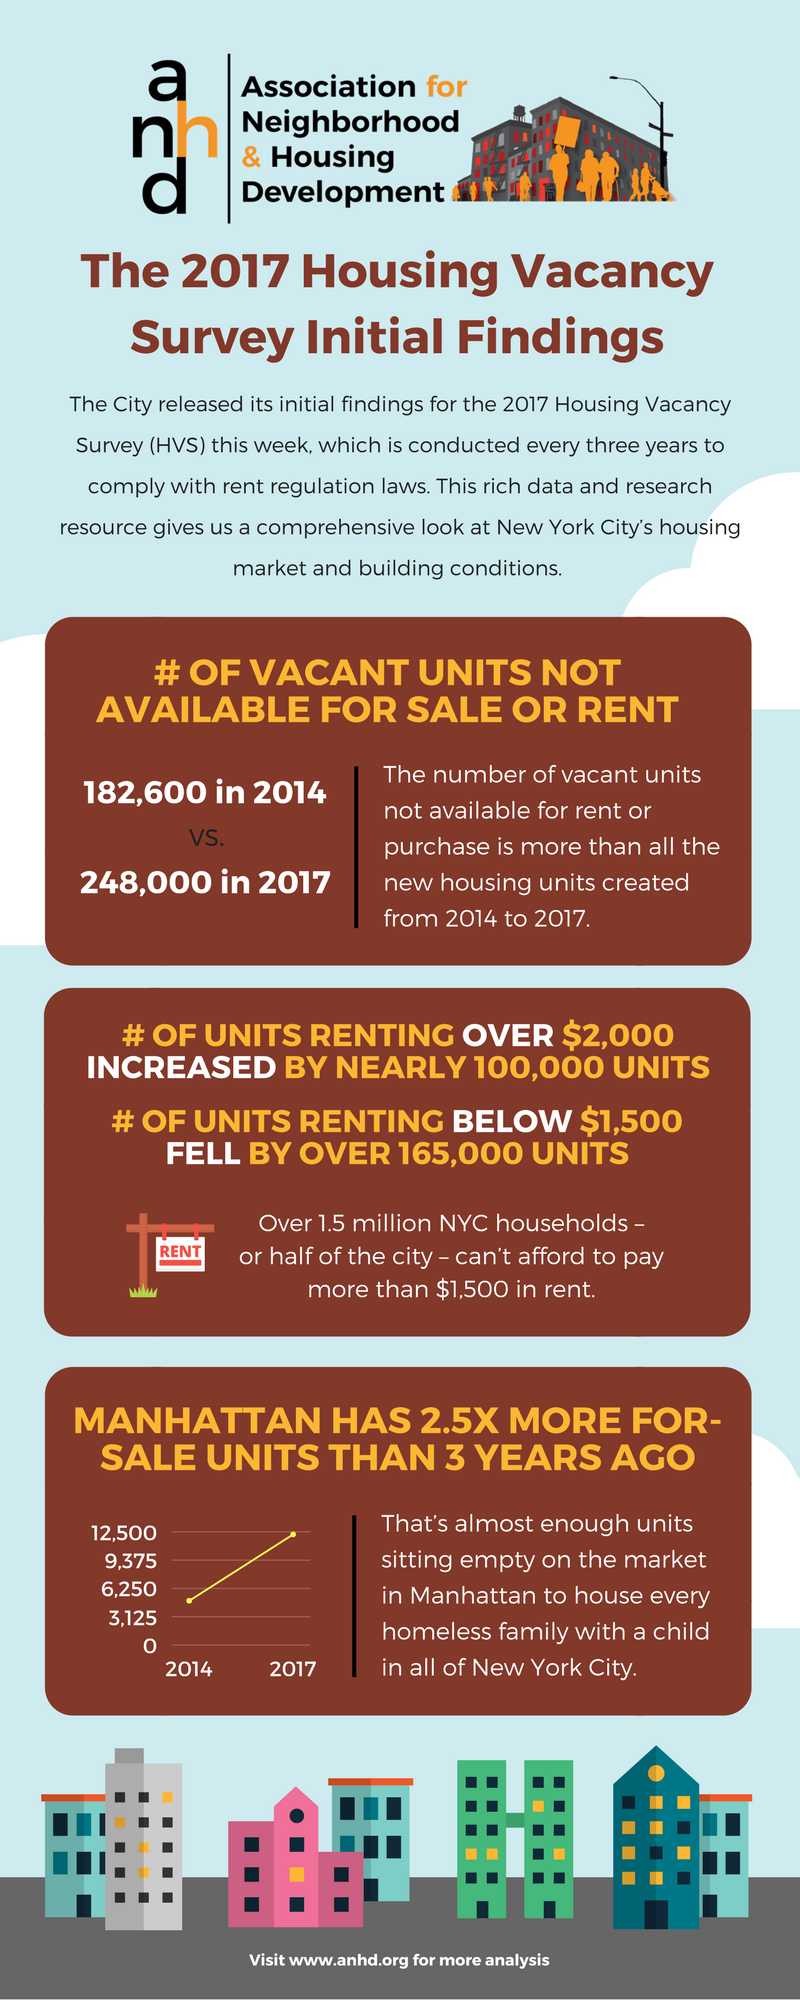
The City released its initial findings for the 2017 Housing Vacancy Survey (HVS) this week, which is conducted every three years to comply with rent regulation laws. This rich data and research resource gives us the only comprehensive look at New York City’s housing market and building conditions. We already knew New York City was in the midst of an affordability emergency, but the initial 2017 HVS findings raise serious new concerns about the direction of our housing market and affordability trends.

Despite the recent building boom, the share of rental units in the City fell from 64.2% in 2014 to 62.9% in 2017, and the share of homeownership units dropped during the same period. So, why have the share of rental units and homeownership units dropped? And what’s left? New York City saw a huge jump in the number of vacant units not available for sale or rent, from 182,600 in 2014 up to a whopping 248,000 in 2017. The number of vacant units not available for rent or purchase is more than all the new housing units created from 2014 to 2017. This jarring statistic begs the question, what’s all the new development really going towards?

It’s no surprise that the number of units with high rents is on the rise, and the number of units with low rents is declining. According to the HVS, the number of units renting for over $2,000 increased by nearly 100,000 units. Conversely, the number of units with a rent below $1,500 fell by over 165,000 units. All of this is happening while over 1.5 million New York City households – or half of the city – can’t afford to pay more than $1,500 in rent.

Additionally, the median asking rent jumped 33.9% from 2014 to 2017, which underscores our fight and our members’ fights against displacement. Tenants who lose their units – for whatever reason – can’t find a place to live without paying more, a lot more.

In comparison, the median rent for rent-regulated units – which is home for many of the City’s low- and moderate-income families – increased by 2.6%. On average, rent-regulated households earn $22,000 less a year than households that rent market-rate units. Holding on to an affordable rent-regulated unit has never been more critical to maintaining affordability for a household.

Meanwhile, Manhattan has 2.5 times more for-sale units sitting on the market than it did just 3 years. The number of owner-occupied units for sale in Manhattan jumped from 4,833 in 2014 up to 12,164 in 2017. That’s almost enough units sitting empty on the market in Manhattan to house every homeless family with a child in all of New York City.

The vacancy rate in Manhattan, the highest priced housing market of the five boroughs, rose to 4.73%. Meanwhile the Bronx, the City’s lowest priced housing market, had the lowest vacancy rate of just 2.71%. The lower priced units in the Bronx that are more affordable to New Yorkers are quickly sought and filled. Manhattan’s high housing prices mean much of their rental market is out of reach for most New Yorkers, leaving more vacant rental units sitting on the market unrented. This is a cautionary tale of what could come if the City’s overall housing prices continue to rise further out of reach for New Yorkers’ incomes. It’s clear that price matters when counting units; New Yorkers demand low-priced units, not luxury towers.

Over the next week, ANHD will be tweeting critical facts from the 2017 Housing Vacancy Survey’s initial findings. And look out for an in-depth look at New York City’s housing market and conditions later this year when the 2017 Housing Vacancy Survey data is released.


Barika Williams, ANHD’s Deputy Director


ANHD Releases New District-Level Tenant Displacement Risk Tracking Tool

ANHD Releases New District-Level Tenant Displacement Risk Tracking Tool

The Association for Neighborhood & Housing Development (ANHD) is excited to release the next phase of our Displacement Alert Project (DAP): DAP District Reports. DAP Reports provide monthly updates on harassment and displacement risk in rent stabilized buildings across New York City’s 59 community districts. The reports are a crucial new tool for grassroots groups, tenant organizers, community members, and elected officials. They allow you to:

  • Access lists of at-risk buildings arranged by address, color-coded, and sorted by each community district.
  • View reports on your computer, phone, or print them out in a clear format to take offline and into the field.
  • Look back at reports from previous months.
  • Navigate directly to a property page on ACRIS, HPD, DOB, DOF tax bills, OASIS map, and Google Maps.

Tenant organizers can use the reports to identify the most at-risk buildings in their neighborhoods and prioritize outreach. District Reports data can support work to keep tenants in place and preserve rent stabilized units by making organizers’ research faster and easier.

Community members can use the reports to understand threats to tenants and existing affordable housing at the neighborhood level.

Elected officials can use the reports to monitor the risk to stabilized buildings in their districts and their offices can use them to support tenants facing harassment.

And, while DAP Map provides a citywide view of displacement risk, DAP District Reports give researchers and the public the opportunity to understand current risk in detail and at the neighborhood level.

Here is a small sampling of what we found this month with the DAP District Reports:

  • 300+ apartments in 9 rent stabilized buildings were sold in Washington Heights/Inwood (Manhattan CB 12) for a total of $75 million.

High sales prices can mean the new owner plans to displace existing stabilized tenants to make large profits.

  • The Bronx had the most stabilized buildings with 5 or more new Housing Preservation & Development (HPD) complaints – 930 with more than 11,000 complaints in just December alone.
  • HPD issued 10+ violations most frequently in Brooklyn rent stabilized buildings, more than 4,500 violations total in 260 buildings.

Buildings accumulating many HPD complaints or violations in a month can indicate a landlord is actively harassing or neglecting tenants in an effort to push them out of their apartments.

DAP Reports build off ANHD’s interactive data visualization DAP Map, which was launched last year, taking public data related to housing and presenting it in a more easily accessible way for users to understand where there are heightened risks of displacement in New York City. It compiles fragmented information from various public records and databases, and makes it more easily accessible for advocates – especially organizers and activists – by displaying it in one place, with intuitive, color-coded metrics.

For more information on how to use the DAP District Reports, visit the Tutorial Page. For specific questions or press inquiries, please contact Lucy Block at lucy.b@anhd.org.

Taking Care of Business: Understanding Commercial Displacement in New York City

Taking Care of Business: Understanding Commercial Displacement in New York City

New York City’s small businesses are in the midst of a displacement crisis. As stores shutter and communities lose long-time institutions, the mechanisms and realities of this crisis are left under-examined. The Association for Neighborhood & Housing Development (ANHD) analyzed the economic vitality of small businesses across the city, neighborhood-by-neighborhood.

In our 2017 report, Taking Care of Business: Understanding Commercial Displacement in New York City, we focus on New York’s small businesses, which ANHD defines as firms with 20 or fewer employees. The analysis examines the small business landscape in New York City, neighborhood-by-neighborhood. Our hope is that this information helps spark more informed and in-depth conversations among community groups and policy makers to develop effective strategies to serve and support New York City’s small businesses.

KEY FINDINGS

Overall, New York City saw a 2% rise in total business creation over the past five years. This means that there were slightly more businesses in the City in 2016 than there were in 2011. While the percentage of businesses in New York grew over the course of five years, net change varied widely by neighborhood.

Manhattan as a whole experienced the most decline in total business, with every neighborhood except Chelsea and Central Harlem experiencing a net loss in businesses. Queens and Staten Island saw the most net growth, with a 4% and 5% rise in businesses overall, while total businesses in Brooklyn and the Bronx grew by a smaller 1% and 2%, respectively. While the outer boroughs all saw a net increase in businesses, Manhattan experienced a 2% net loss, with the greatest decrease in businesses concentrated in Stuy Town and in the Upper East Side. As New York’s neighborhoods change, the City needs to ensure that long-standing businesses have the necessary support and opportunity to survive and thrive.

Manhattan is still home to the largest concentration of businesses in the City, with 44.4% of all of New York businesses located in the borough. Brooklyn follows with 23.8% of businesses and Queens follows close behind with 20.5% as home to all New York firms. The Bronx and Staten Island lag much further behind, home to only 7.5% and 3.9% of all of New York City’s businesses.

Tracking changes in businesses by neighborhood is crucial, especially changes in small businesses, since 26% of all jobs in New York City are at firms with 20 or fewer employees. In immigrant and majority people of color neighborhoods, employment in small businesses tends to be much higher.

Businesses in the outer boroughs still receive much fewer small business loans, at half the rate of Manhattan businesses, which received an average of 2,783 loans. Bronx businesses received the fewest loans at an average of 439 loans across the borough, while Brooklyn, Queens, and Staten Island fared better with a respective borough-wide average of 1,742, 1,509, and 1,454 businesses receiving loans. Outside of the Bronx, Brownsville and East Harlem similarly received among the fewest loans citywide, at 260 and 635 respectively — much lower than the citywide average of 1,623 loans. This pattern suggests that communities of color, in particular communities in the Bronx and upper Manhattan, are losing access to localized economic development and opportunity. The lack of small business financing in these neighborhoods means a lack of small business jobs, which are sorely needed in communities with among the highest rates of unemployment in the city. Small business loans must be made accessible to all of New York’s communities not just it’s wealthiest.

The displacement of neighborhood institutions not only threatens New York’s identity, but also eliminates jobs, community spaces, and affordable resources in low- and moderate-income communities of color. As the city’s small businesses disappear at an alarming rate, it is vital to implement robust protections to ensure their survival, and in turn ensure the vitality and vibrancy of New York’s neighborhoods.


Click here to download our full report.

Click here to download your copy of the Understanding Commercial Displacement in New York City 2017 Chart.


Lena Afridi, ANHD’s Policy Coordinator for Equitable Economic Development

New Map of Preferential Rents Shows the Displacement Risk for Rezoning Neighborhoods and Low Income Communities City-wide

New Map of Preferential Rents Shows the Displacement Risk for Rezoning Neighborhoods and Low Income Communities City-wide

Last week, ProPublica launched a new tool mapping the number of rent stabilized apartments with preferential rents by zip code, throughout New York City. The results are eye-opening. Almost a third of all rent stabilized apartments in New York currently have preferential rents: over 250,000 units citywide. That’s over 250,000 households that do not truly enjoy the protections of rent stabilization. That’s over 250,000 households that are at risk of displacement, especially in low-income communities.

The use of preferential rents directly undercuts the protection and stability rent stabilization is intended to provide, leaving tenants vulnerable to large rent increases at every lease renewal, regardless of the rates permitted by the Rent Guidelines Board.  Especially troublesome is the prevalence of preferential rents in some of the city’s poorest neighborhoods. Six of the ten New York City zip codes with the most preferential rents are in the Bronx, with poverty rates in those areas ranging from 30 to 43 percent – a population that cannot afford a big rent increase.

Of equal concern is the fact that many of these neighborhoods with high numbers of preferential rents are in areas where the de Blasio administration has proposed large-scale rezonings, further exacerbating the risk of displacement. This is a risk the City does not adequately address. The city is mandated to consider how a rezoning could impact current residents, including potential displacement. And yet, when considering displacement risks, the City excludes rent stabilized tenants from their analysis, under the erroneous assumption that their tenancy is secure. The prevalence of apartments with preferential rents shows just how wrong this is.

Take East Harlem as an example, which is currently going through ULURP for a neighborhood rezoning. In its Draft Environmental Impact Statement, the City found no adverse impacts due to secondary displacement. But again, the City did not consider rent stabilized tenants in their analysis. According to ProPublica there are close to 5,000 apartments with preferential rents in the two zip codes that include East Harlem. This means almost 5,000 families are not subject to the limits on a rent increase that rent stabilized tenants depend on. How can these 5,000 families be considered secure in their apartment then, or free from displacement risk? As land values and rents increase following the rezoning, there’s nothing to stop a landlord from raising the rent to a level that might force a tenant out.

The same concern exists around the proposed Jerome Avenue rezoning in the South Bronx, where there are close to 9,000 apartments with preferential rents in the two zip codes spanning the area – two zip codes with poverty rates over 40%. The same concern exists in Inwood, or Bushwick, and the list goes on. These are by far not the only households at risk of displacement, both in these rezoning neighborhoods and throughout the city. But these are households we know are at risk just from preferential rents alone.

The goal of the de Blasio administration’s Housing New York plan is to both construct and preserve affordable housing. Rent stabilized housing makes up the largest portion of our city’s existing affordable housing stock. The new data on preferential rents illuminates once again the vulnerability of rent stabilized tenants, and the need to place protections for existing residents and preservation of existing affordable housing at the center of any affordable housing plan intended to actually address the affordability crisis facing our city.


Christopher WaltersANHD’s Rezoning Technical Assistance Coordinator

CASA’s New White Paper Gets to the Heart of The Displacement Debate

CASA’s New White Paper Gets to the Heart of The Displacement Debate

Last week, Community Action for Safe Apartments (CASA) released a powerful new white paper, “Resisting Displacement in the Southwest Bronx.” Drawing on research, their own organizing experience and the experience of tenants in the neighborhood, the paper lays out the myriad displacement pressures Bronx residents face, the ways in which a rezoning would exacerbate those pressures and tangible solutions that must be put in place to alleviate them.

The paper highlights the role harassment plays in forcing tenants out of their neighborhoods and strongly pushes back on the City’s stance that rezonings do not cause displacement. Countering this narrative is especially important in a low-income community of color like the Southwest Bronx, where the history of race, class and displacement cannot – and must not – be ignored. CASA outlines some of the tactics landlords use to push out their tenants, including the denial of services and repairs, using loopholes in the law to raise rents through Major Capital Improvements, non-rent fees, preferential rents, and bringing frivolous cases to Housing Court. If the proposed Jerome Avenue rezoning goes through – significantly increasing existing land value – the incentive to displace tenants as a way to increase profits will be even greater. Unfortunately, the City’s proposed mitigations for this – the creation of affordable housing through Mandatory Inclusionary Housing and existing subsidy programs – are not sufficient, as the units created are at income levels beyond the reach of most neighborhood residents and cannot make up for the loss of existing homes.

This is why CASA is calling for new solutions to fight displacement before any rezoning moves forward. The proposals include creating an affordable housing subsidy program that truly matches the neighborhood’s need and a package of strong tenant protection measures such as Right to Counsel and a city-wide Certificate of No Harassment (CONH) program.

In laying out the reality and dangers of displacement in the Southwest Bronx, the paper makes the crucial point that the experience and voice of neighborhood residents on this issue cannot be ignored or glossed over. These tenants are not speaking up against a rezoning because they are uninformed, misinformed, reactionary or simply afraid of change. They are speaking up because they are experts in what is happening in their neighborhood. They know best about the reality of displacement and the threat it poses to their community. They know best what solutions must be in place to create a new path forward.

It is this community vision that CASA eloquently lays out in their paper’s conclusion:

“The other possibility, the one we fight for, is that this will prove to be a rezoning for low-income tenants of color. That the rezoning will be buttressed by so many anti-displacement policies that it will be something different: investment that corrects the past wrongs of our City’s developers and policy makers and creates a new path forward of development without displacement. If we cannot figure out how to bring investment in the Southwest Bronx without displacing thousands of tenants, without repeating our past, then we can’t do it anywhere.

But if we can do it here we can do it everywhere.

Dear New York Times Real Estate Section

Dear New York Times Real Estate Section,

Your front-page article this weekend, with the headline “Finding Washington Heights” and gauzy illustration of a beatific white woman framed in a sea of darker faces, went too far.

Why bother to write to you, Real Estate Section? The obvious answer is that the headline is offensive; Washington Heights is a long-standing, vibrant community with a concentration of working-class, Spanish-speaking New Yorkers that was not, in fact, first discovered by the woman in the illustration. The title and illustration makes the unspoken racial dynamic of the article clearly, painfully, and distressingly clear. These days, this is called the ‘columbusing‘ of long-established communities of color and immigrant neighborhoods. There was no discovery; people have been there for generations.

But here is the larger point, Real Estate Section: you are part of an important news organization that sees itself as “the paper of record”.  You have an obligation to be more than a glossy supplement for the real estate industry, pushing juicy articles designed to excite the market in whatever neighborhood the industry wants to make the next frontier of gentrification.

Any responsible article should include the context that many neighborhoods across New York City are reaching a crescendo of concern about the crisis of gentrification, displacement, and tenant harassment that people and neighborhoods experience when they are pushed out of their community against their wills to make way for people with more economic power and social capital.

Washington Heights is one of the neighborhoods at the epicenter of this crisis. Developers have driven up the price of residential real estate in that neighborhood by 96% in the past five years, while the incomes of current residents have gone up by only a fraction, and thousands of Washington Heights residents have been pushed out of their affordable apartments. The neighborhood has lost more than 5,600 rent regulated units since 2007, a devastating blow for a working class community in a city where affordable housing is vanishingly scarce.

This matters to our city. It matters because it is brutally unjust to the people who are displaced, and harassed out. It matters because the people being pushed out are too often from working-class, immigrant, and communities of color that are part of the economic and racial mix that we all value. It matters because in this day and age, cities have increasingly become the essential centers of economic opportunity, and when whole communities are pushed out to the margins and beyond, they are locked out of that opportunity and fall further behind.

But, Real Estate Section, instead of giving us the service of an article that acknowledges this social and political reality, you give us an article that is a colonialist travelogue with the first-person point of view of a privileged person touring around a neighborhood that she can appropriate merely by looking at it.

I know you say that you are just a real estate section, and your job is to show attractive things to people who can buy real estate, so of course your point of view skews to people who tend to be white and wealthy, and naturally you write for those who are able to afford an ethnically exotic “new” neighborhood that you show as ripe for exploitation.

What would an article titled “Finding Washington Heights” be if it were written from the point of view of a long-time resident in a rent-regulated apartment writing about her neighborhood?

You are a part of a great newspaper with significant influence. Dear Real Estate Section, you should be more than a vehicle for real estate sales. You can cover the real estate market like a real newspaper and not be an active agent for speculation, displacement, and gentrification.

Thank you for considering this advice, Real Estate Section.

ANHD Releases Interactive On-Line Data Map That Pinpoints Displacement

Displacement Alert Project Map Gives Activists and Policy Makers Key Information to Proactively Address the Displacement Crisis

The tenant displacement crisis is at the center of neighborhood concerns and City policy focus. We cannot allow market forces to price and push out our City’s diverse communities. ANHD today released the Displacement Alert Project Map (the DAP Map) that, for the first time, presents key information in an interactive, easy-to-use map that local activists, service providers and policy makers have long needed.

www.dapmapnyc.org

The DAP Map is a web-based, building-by-building map designed to show where residential tenants may be facing significant displacement pressures across New York City. Read the exclusive report about the DAP Map in this piece published today in the New York Times –  New Tool Shows New York Neighborhoods At Risk Of Rent Hikes

The DAP Map has three data view options and one combined risk score view. Each view option is based on unique data compiled by ANHD. The map shows previously unavailable building-level data, and color-codes buildings by risk-level so the information is clear and intuitive:

  • Is there a high rate of loss of rent-regulated tenants in the building?
  • Do NYC Department of Buildings permits indicate a high rate of tenant turnover?
  • Was the building sold for a price that might indicate a speculative investment strategy? 
  • Where do we see building facing multiple combined risks?

Clicking on any individual building and details about that particular risk in that building appears in a pop up box. The DAP Map can also be searched by entering an individual building address.

ANHD developed the DAP Map as a strategic tool for tenants, community groups, service providers and policy makers who want to address NYC’s displacement crisis. Our ANHD neighborhood groups know that growing market pressures are impacting existing affordable housing, and increasing tenant harassment and displacement in many neighborhoods. The DAP Map can be used to:

  • Identify at-risk buildings.
  • Provide proactive outreach and education tenants.
  • Identify where and why neighborhoods might be experiencing a wave of displacement pressure.
  • Align government policies on displacement to real-time displacement forces and trends. 

The DAP Map data is currently viewable only at an individual building level – aggregate data will be included in the next phase of the project. Meanwhile, ANHD analyzed the aggregate level data and found the following neighborhood patterns:

  • There are 96,000 multi-family buildings in the data set. They all had at least one indicator of potential displacement concern: sold in 2015, at least one rent regulated unit since 2007, or had a residential DOB since 2013.
  • New York City has lost over 156,000 rent-regulated units from 2007 to 2014.
  • Nearly 26% of the buildings on the DAP Map have a high risk score, suggesting increasing rents.
  • In over 5,400 buildings, the 2015 sales price per unit increased by more than double the 2010 area average.
  • Just 10 zip codes account for one-quarter of all the buildings in NYC that lost a high percentage of rent regulated units between 2007 and 2014.
  • Twenty-five zip codes account for one-half of all the NYC buildings that lost a high percentage of their rent regulated units in that same time period.
  • In those same 25 zip codes, there is a correspondingly high number of Department of Buildings permits, with 16 of these zip codes showing exceptionally high DOB permit activity.
  • In those same 25 zip codes, there is a correspondingly high number of exceptionally high per-unit property sale prices. In 12 of those zip codes, the average per-unit sale price was 150% above the average price in the surrounding area.

New York’s low-income communities, communities of color, and immigrant communities have been disproportionately impacted segregation, redlining, and predatory practices, and are increasingly feeling pushed out of our City. ANHD and our members are committed to stopping New York City’s growing displacement crisis and building a more equitable future for all of our City’s neighborhoods.

The DAP Map can be a tool to uncover problem buildings and patterns that City policy can help to address. This past spring, Mayor de Blasio committed to enacting a new, city-wide Certificate of No Harassment program as one key tool to help prevent displacement and preserve affordable housing.