Furman Report Shows that
Despite New Construction,
the Affordability Crisis Continues
There remains a stark mismatch between the kinds of housing being created in New York City and the kinds of housing New York City’s existing households need.
Last week, the NYU Furman Center released their 2017 State of the City report and Focus on Changes in New York City’s Housing Stock. As always, it contains an array of valuable information about trends in our housing stock and population. One striking conclusion from all of the panelists at the Furman Center’s release event was that there remains a stark mismatch between the kinds of housing being created in New York City and the kinds of housing New York City’s existing households need.
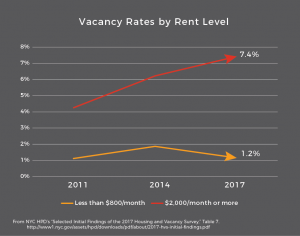
Construction is booming, but vacancy rates at the top of the market are large and increasing. At the bottom of the market, the opposite is true.
The NYC Department of Housing Preservation and Development (HPD)’s recent Housing and Vacancy Survey[1], as we commented on in March, further illuminates these trends. The HVS showed that vacancy rates for all apartments renting below $1,500 per month decreased between 2014 and 2017. The vacancy rate for apartments renting for less than $800 is now 1.2%–these apartments serve our lowest-income New Yorkers that make below 40% Area Median Income (AMI), or around $33,000 per year. At the top of the market, apartments renting for more than $2,000/month have a vacancy rate of 7.4%. The supply of housing serving moderate- and high-income New Yorkers is increasing, while the supply of housing for lower income New Yorkers is decreasing.[2]
The Furman Center’s analysis underscores the unavailability of housing for New York City’s lowest-income residents. Furman found that less than 10% of recently available units are affordable to those making 30% of AMI and below. In a market that is tight overall, that makes it extremely difficult for those households to find adequate new housing.
The data also shows large and increasing differences between median rents of all existing rentals and new rental units built in the last 10 years: there was no difference in 2000, but newly constructed rentals were $375 more per month in 2016. This includes Inclusionary and other subsidized housing, masking a much larger difference between existing and new market rate rents. David Kramer, President of the real estate development firm Hudson Companies, pointed out during the Furman Center’s May 25 panel discussion on their report that the median rent of newly constructed market rate housing should be much, much higher than the $1,725 that Furman found. Newly constructed housing is serving the top of the market and not increasing availability for the lowest-income New Yorkers. Increasing the supply through new market rate development simply isn’t driving down rents in our existing stock.
We need to become much clearer about the distinction between general housing supply and affordable housing supply. And we need to stop looking primarily to construction for solutions to New York City’s affordability crisis.
We must look to our existing stock of affordable housing that we are hemorrhaging every day due to predatory practices by landlords (see the May 20 New York Times piece), speculative real estate development, and expiring affordability. We must examine the pressure that new development puts on that housing, even when it includes Mandatory Inclusionary Housing units. And we must ensure deep and permanent affordability in new affordable construction, particularly by encouraging development by nonprofits.
Lucy Block, ANHD’s Research and Policy Associate
————————-
[1] NYC HPD, Selected Initial Findings of the 2017 New York City Housing and Vacancy Survey, Table 7. February 9, 2018.
[2] Moderate-income (120% AMI) New Yorkers can afford apartments that rent for $2,800/month. There were 9,000 vacant units renting for more than $2,500 in 2011 and 27,000 such units in 2017, according to HVS. That corresponds to vacancy rates of 4.8% and 8.8%.
 ANHD 2016 Building the Community Development Movement

