New ANHD White Paper: Why is Non-Bank Lending Highest in Communities of Color?
New York is a city of renters, but nearly a third of New Yorkers own their own homes. The stock of 2-4 family homes provides an important source of affordable rental housing in many neighborhoods. Secure and affordable homeownership has long been recognized as an important way for people to build wealth and move into the middle class. Yet, lower-income people and people of color have consistently been locked out of the housing market or targeted with harmful lending products and practices. In the years since the 2007 economic crisis, low- and moderate-income (LMI) New Yorkers and people of color have faced significant barriers to homeownership in New York City.
In this new white paper analyzing trends in 1-4 family home lending in New York City, the Association for Neighborhood & Housing Development (ANHD) uses newly released Home Mortgage Disclosure Act (HMDA) data from 2016 to update a paper we published in 2016 based on trends in the 2012-2014 HMDA data.
We found that non-bank lenders are taking over an increasing portion of lending on 1-4 family homes, particularly to borrowers of color and low- and moderate-income (LMI) borrowers. Lenders in HMDA are categorized as banks, credit unions, and non-bank lenders, which are mortgage companies that do not take deposits from customers or businesses. We define non-bank lenders as non-depository lenders that are not owned by or affiliated with a bank or credit union.
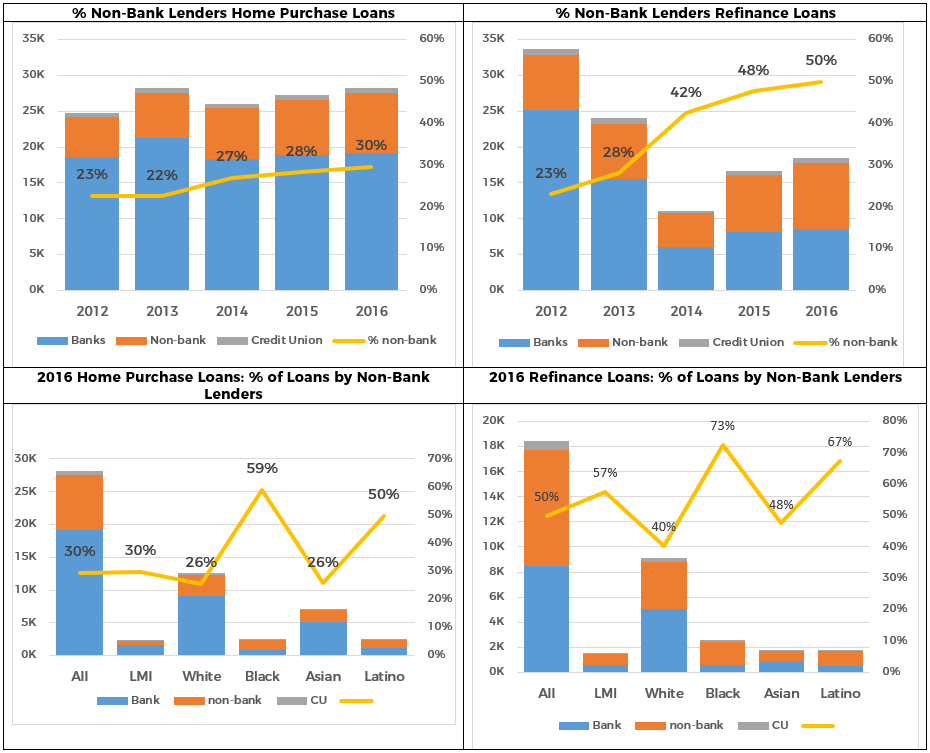
- In 2016, 30% of all home purchase loans were originated by non-bank lenders, up from 23% in 2012. The percentage of non-bank lenders was 50% for refinance loans in 2016, up from 23% in 2012.
- Non-bank lenders made 30% of home purchase loans to LMI borrowers and 58% of refinance loans to LMI borrowers. They also accounted for 31% of home purchase loans and 61% of refinance loans in LMI neighborhoods.
- 25% of home purchase loans to White borrowers were made by non-bank lenders versus 59% and 50% of the loans to Black and Hispanic borrows, respectively. Similar disparities appear for refinance loans.
Much of the disparities to LMI borrowers and borrowers of color relates to the higher concentration of Federal Housing Administration (FHA) loans to these populations and the decline in FHA lending by the largest banks. There certainly remain questions about qualified borrowers possibly being steered to FHA loans, which are more expensive than conventional loans. But, the overall concern this trend raises is that non-bank lenders are far less regulated than their bank-chartered peers, nor are they covered by the Community Reinvestment Act (CRA). In the run up to the 2007 economic crisis, the majority of dangerous sub-prime loans were made by non-bank lenders chasing relatively high rates of return for their investors and basing their businesses on relatively costly sources of capital.
The data does not suggest that the growing role of non-bank lenders is having a negative impact at the moment because most lending is still made within the appropriate Qualified Mortgage and Ability To Repay standards that were established in post-crisis reforms. However, recent economic history has shown that unregulated non-bank lenders – which depend on non-depository sources of capital – will always be motivated to find a loophole in the regulations, which allow for short-term gain with unwise loans in exchange for potential long-term damage to the communities in which the loans were made. In this climate of deregulation, we are concerned this could come back.
Other finding in this white paper include:
- Home purchase loans citywide increased in 2016. From 2014 to 2016, home purchase lending increased by 8.6% (up 4.8% in 2015, then another 3.1% in 2016). Unlike the decline in the prior three years (2012 to 2014), lending to lower-and moderate-income (LMI) borrowers also increased from 2014 to 2016. Lending increased 6.3% in 2015 and then another 1.8% in 2016, exceeding 2012 levels slightly. In 2012, 9.3% of all home purchase loans went to LMI borrowers, but that dropped to just over 8% each year from 2013 to 2016.
- The share of lending by the “Big 4” banks (Chase, Citibank, Bank of America and Wells Fargo) in New York City has been steadily declining, from 48% of home purchase loans in 2012 to 43% in 2016. Their share of HMDA-reportable refinance loans went from 48% in 2012 down to 26% in 2016. Their share of home purchase loans to lower-income borrowers dropped off even more, from 45% to 38% from 2012 to 2016. The share of refinance loans to LMI borrowers largely mirrored the overall trend.
- Racial disparities persist. 22% of New Yorkers are Black and 29% are Latino, yet in 2016, only 8.6% of home purchase loans went to non-Hispanic Black Borrowers and 8.4% to Hispanic borrowers of any race. The percentage to Black borrowers actually declined from 2014 to 2015. Similar disparities appear in the percentage of applications and denial rates.
Addressing these disparities will require a concerted effort on the part of government, banks, and bank regulators. This involves increasing the inventory of affordable homes to purchase, making credit available equitably and responsibly, increasing financial assistance, and increasing access to homeownership and financial counseling. It also means holding banks accountable for irresponsible practices that lock lower-income borrowers and people of color out of the housing market. The City and financial institutions, especially those covered by the CRA, have an obligation to ensure that this opportunity of homeownership is made equitably to lower-income and minority people and communities throughout the city.
Download your copy of the White Paper here.
Jaime Weisberg, ANHD’s Senior Campaign Analyst
 ANHD 2016 Building the Community Development Movement

